Data is a marketer’s best friend — it empowers your business to reevaluate strategies and shift resources to effective marketing channels.
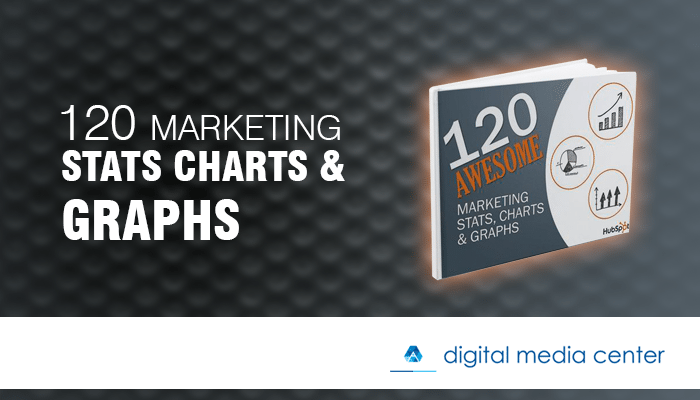
To help you in this planning process, HubSpot has compiled a brand new collection of 120 Awesome Marketing Stats, Charts & Graphs.
This compilation is based on original research and data from a variety of sources, including analysis of our 6,500 business customers, surveys with hundreds of small and medium-sized businesses, and dozens of top-notch publications like MarketingSherpa, eMarketer, Pew Research, McKinsey, and more.
Topics included:
Inbound vs. Outbound Marketing
Search Engine Optimization
Email Marketing
Social Media
Blogging
Facebook
Twitter
+100 pages of powerful marketing charts and graphs that no modern marketer should miss
[fusion_builder_container hundred_percent=”yes” overflow=”visible”][fusion_builder_row][fusion_builder_column type=”1_1″ background_position=”left top” background_color=”” border_size=”” border_color=”” border_style=”solid” spacing=”yes” background_image=”” background_repeat=”no-repeat” padding=”” margin_top=”0px” margin_bottom=”0px” class=”” id=”” animation_type=”” animation_speed=”0.3″ animation_direction=”left” hide_on_mobile=”no” center_content=”no” min_height=”none”][maxbutton id=”21″]
[/fusion_builder_column][/fusion_builder_row][/fusion_builder_container]